Introduction
Proteins are one of the widest category of macromolecules which make up the living
organism as well as
perform structural and functional tasks in a cell. Proteins vary in size, structure
and function but all of them
are made up of long chains of aminoacids connected together by peptide bonds.
One of the major class of proteins are
enzymes and does catalytic reactions
in the cell. Though all proteins are long chains of amino acids they differ in
function. This is mostly due to their
structure. Amino acid sequences fold differently in multiple levels to forms to give
rise to entirely different proteins.
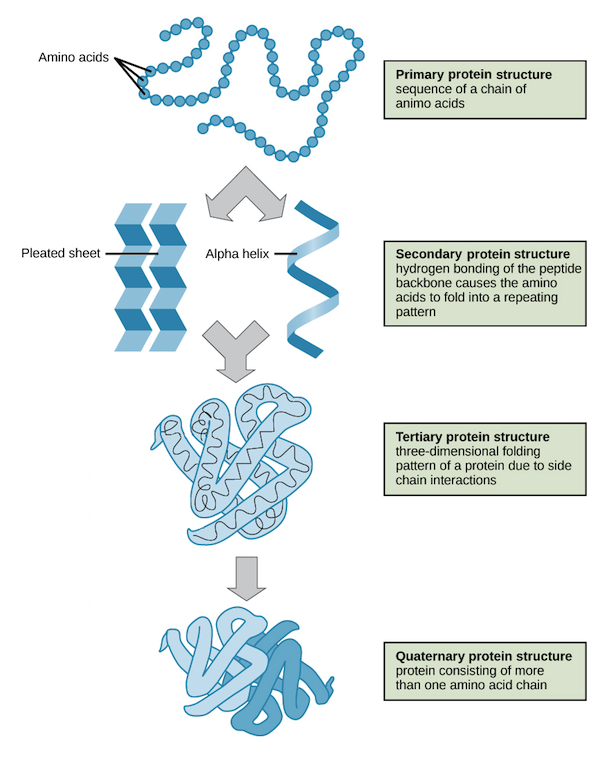
- 1. Primary structure: The long sequences of amino acids are called as the primary structure of proteins.
- 2. Secondary structure: The primary structures will develop hydrogen bonding causing the amino acid sequence to fold into repeating patterns, these patterns are called secondary structures. These can be sheet like structure, helical structures etc.
- 3. Tertiary Structures: Now the secondory structures have side chain interactions which will make them fold in three dimensional patterns. Such structures are celled tertiary structures.
- 4. Quaternary Structure: Many of the tertiary structures come together due to van-der walls interaction and other molecular interaction to form the quaternary structure. This is the final structure of the protein.
Representing 3 dimensional protein structures
There are three main ways of representing the 3d structure of a protein. They are
- Wire frame diagram
- Space filling diagram
- Ribbon diagram
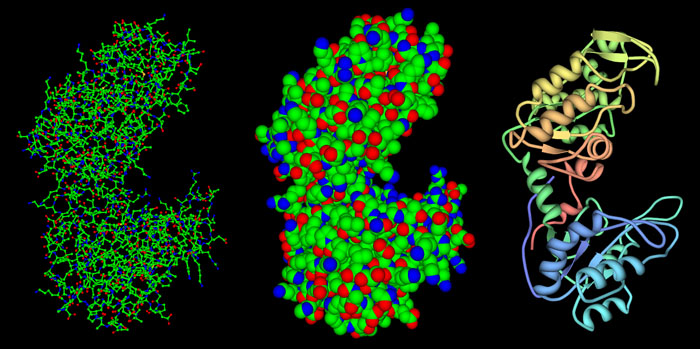
Left: wireframe diagram, Middle: Space filling diagram, Right: Ribbon diagram
Task: Run the Rosetta protein structure prediction simulations and analyze the results
The objective of this assignment is to get an understanding of how computational protein modeling works, looking at protein structures using a viewer and making sense of the squiggles and wiggles. Project files
Pick one of the five test cases in the homework folder and run structure prediction calculations.
I choose 1S12
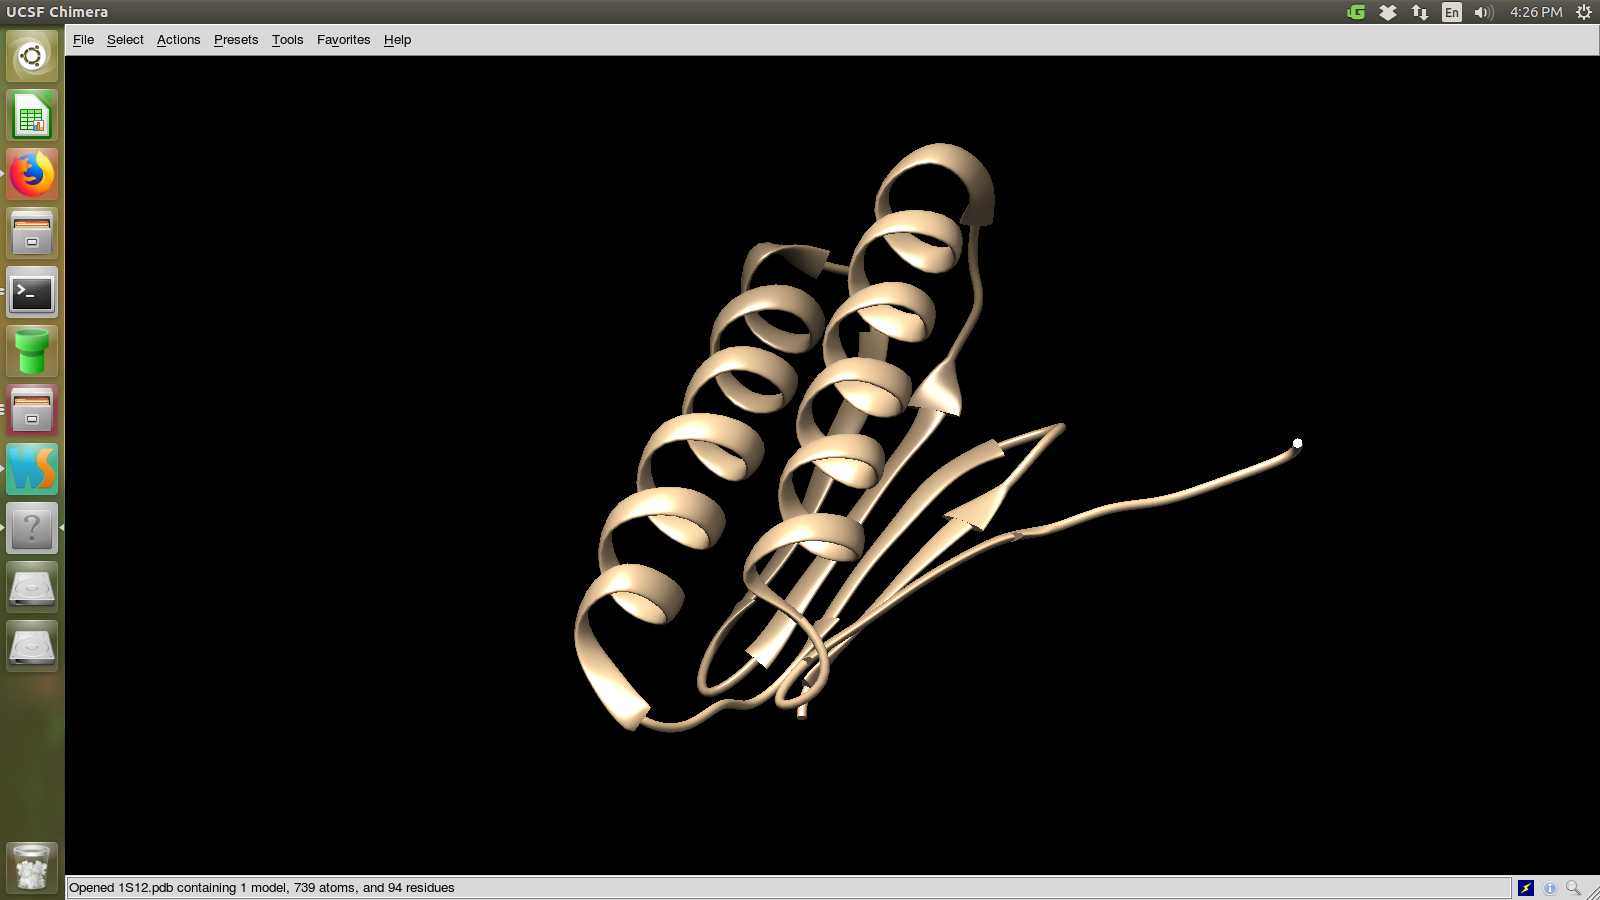
Choose a protein structures viewer (PyMol or Chimera or Rasmol) and view the protein
I used chimera to view the protein. The following is the actual structure of 1s12
protien viewed using the software.
Steps for running the structure prediction program
- Go inside the protein folder
Open the folder homework/structure_prediction/1S12 - Open the settings file
abrelax_flags is the settings file. Open it using any text editor software. I am using vim here.
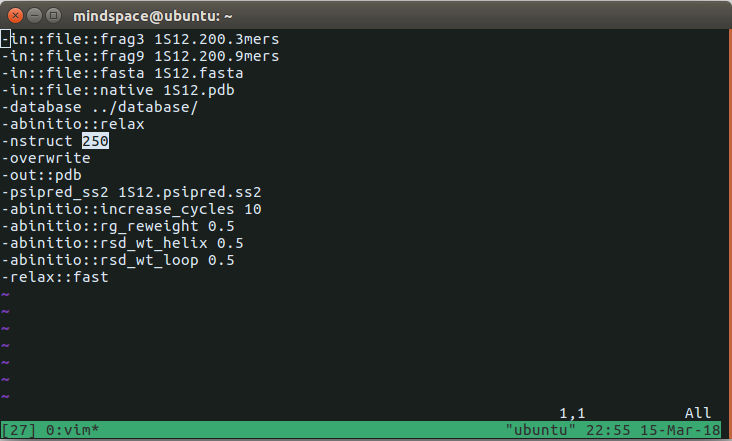
There is a feild called 'nstruct' which represents the number of structures you want to make. I am settings it value to 250. Now save the file - Run the program
Now run the program by using the command "../executable/AbinitioRelax.static.linuxgccrelease @abrelax_flags". (I am using a linux system). Make sure that you are inside the corresponding protein directory while running this command. This program take 5- 10 minutes to generate each model. So keep the program running overnight to generate all the models. - Observe the results
One the program has completed you will find all the 250 models being generated in the folder
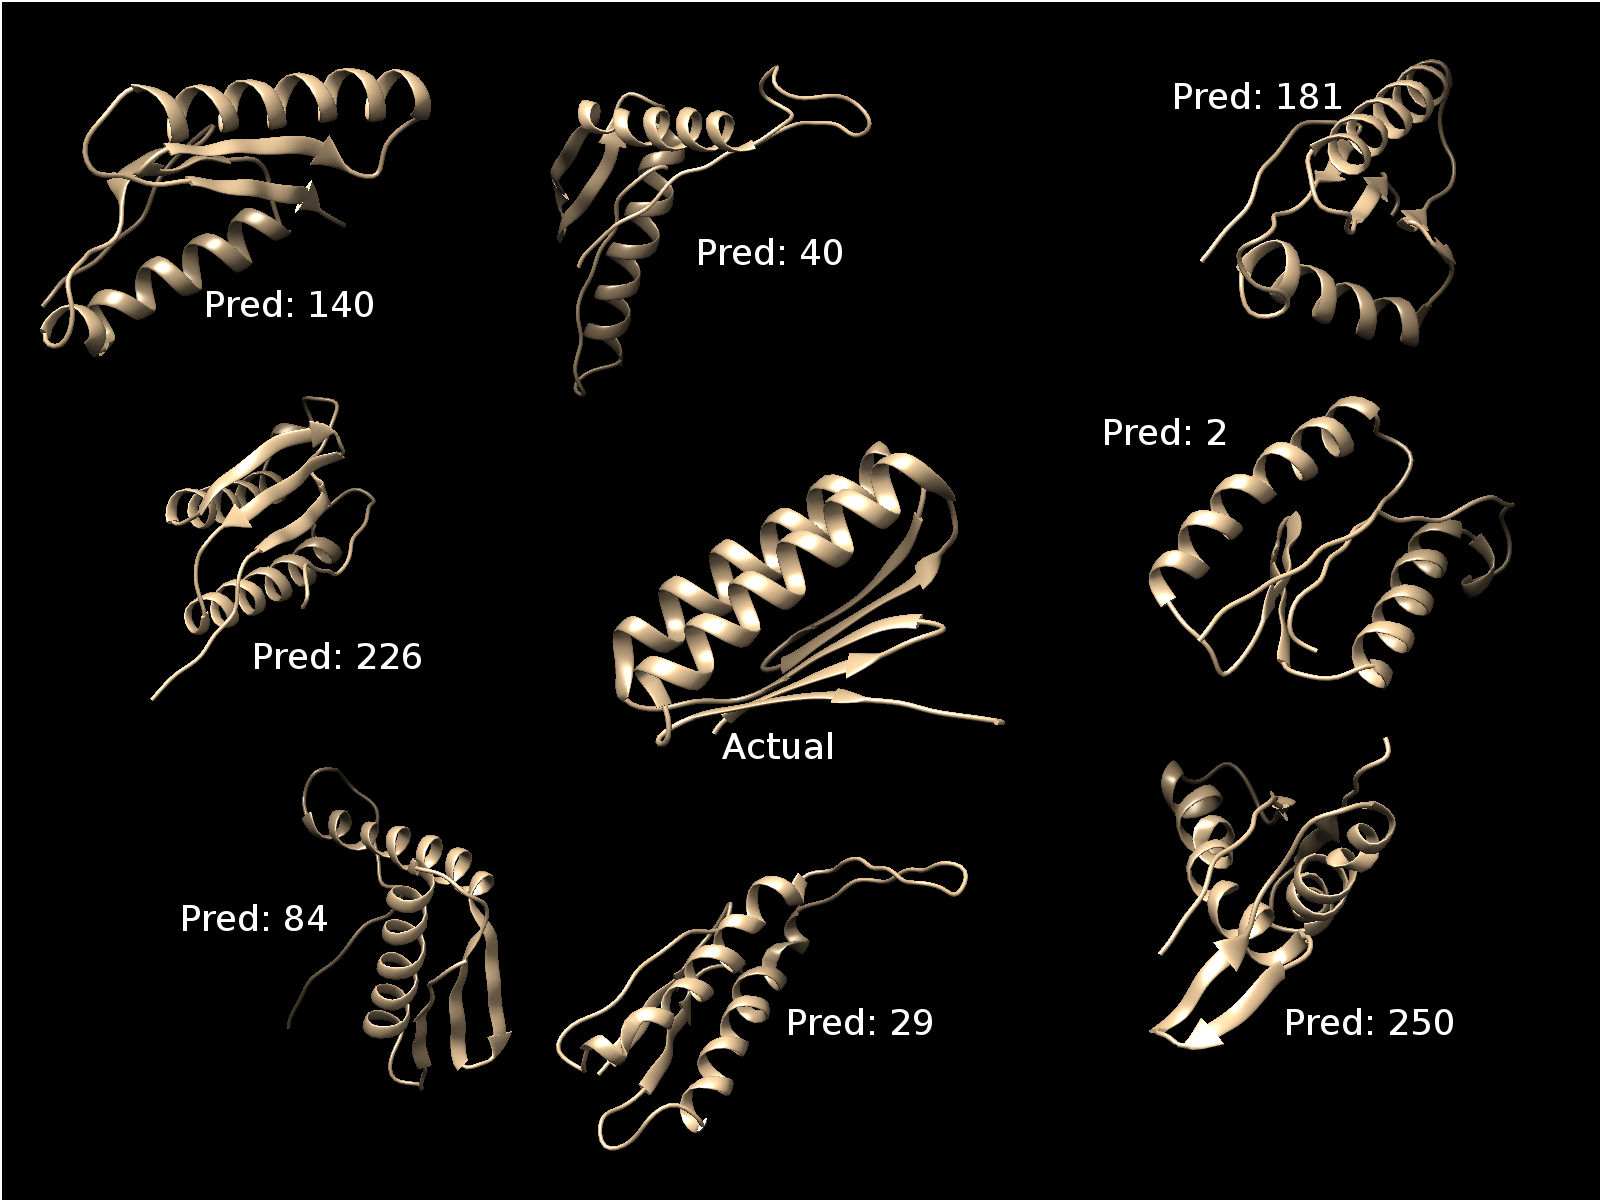
- View some of the predicted structures and compare with the
actual structure
View the structures in chimera viewing software.
Plot the score (or energy) vs rms plot. Rms stands for root mean square deviation. These are two columns in the score.fsc file. Compare that with the energy vs rms plots I showed in my slides.
I am using pandas to analyse the data in the score.fsc in jupyter notebook. I have
attached the file for reference.

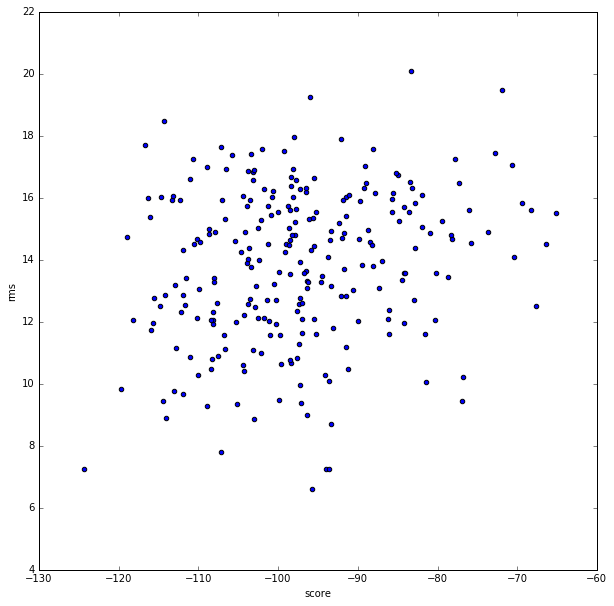
This is the score vs rms plot.
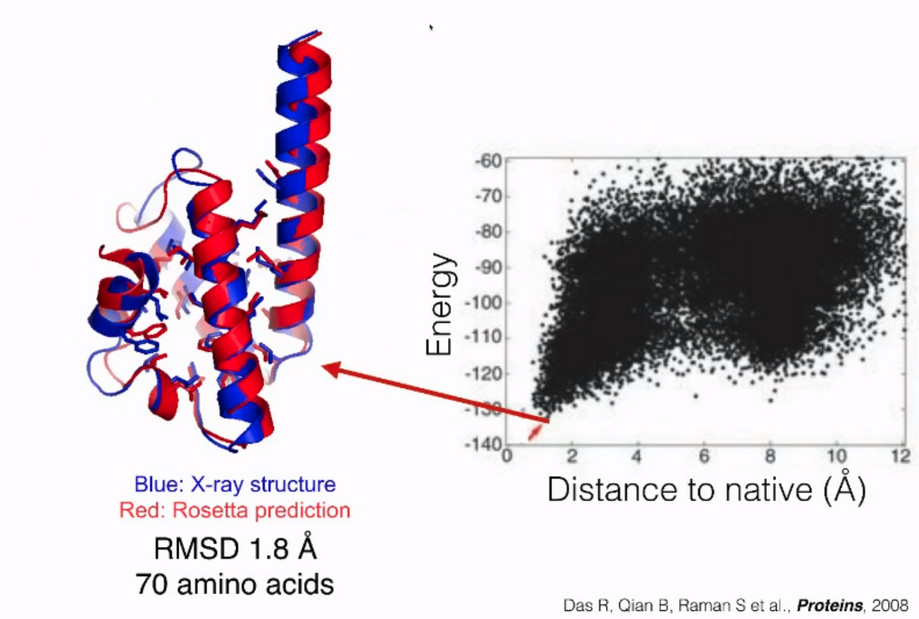
This is the plot shown during the class
The major difference between my plot and the plot shown in the class is that mine
has less data points, ie only limited structures(250)
were included, whereas the one shown in the class has many more.
Pick the lowest energy model and structurally compare it to the native. How close is it to the native? If its different, what parts did the computer program get wrong? You'll have to compare the structures using a Viewer like Pymol or Chimera or Rasmol.
Models with the lowest score
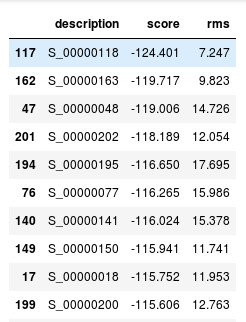
Here in the table we can see that model number 118 is with the lowest score. Lets
visualize that.
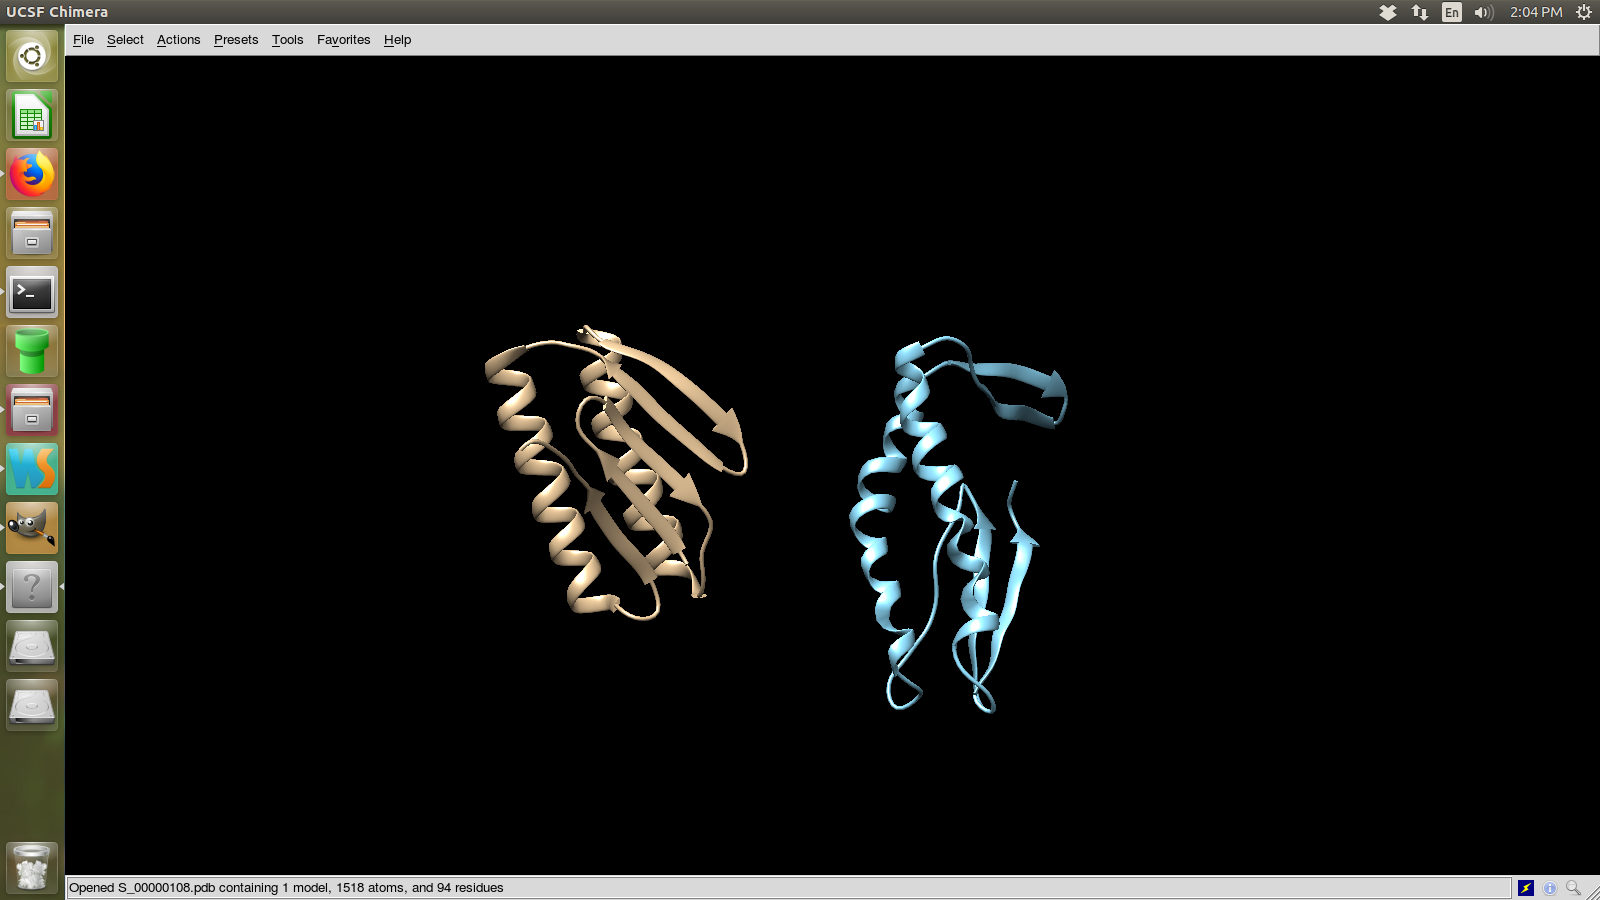
The model in blue is the actual structure and in yellow is the predicted.
Pick the lowest rms model and structurally compare it to the native. How close is it to the native? If its different, how is it different? Remember that in a blind case, we will not have the benefit of an rms column.
Models with the lowest rms
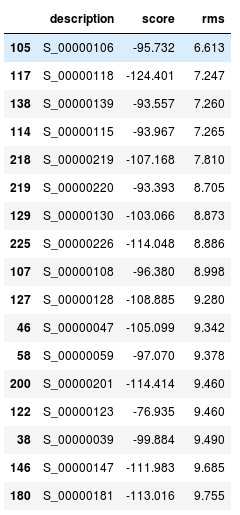
Here in the table we can see that model number 106 is with the lowest rms. Lets
visualize that.
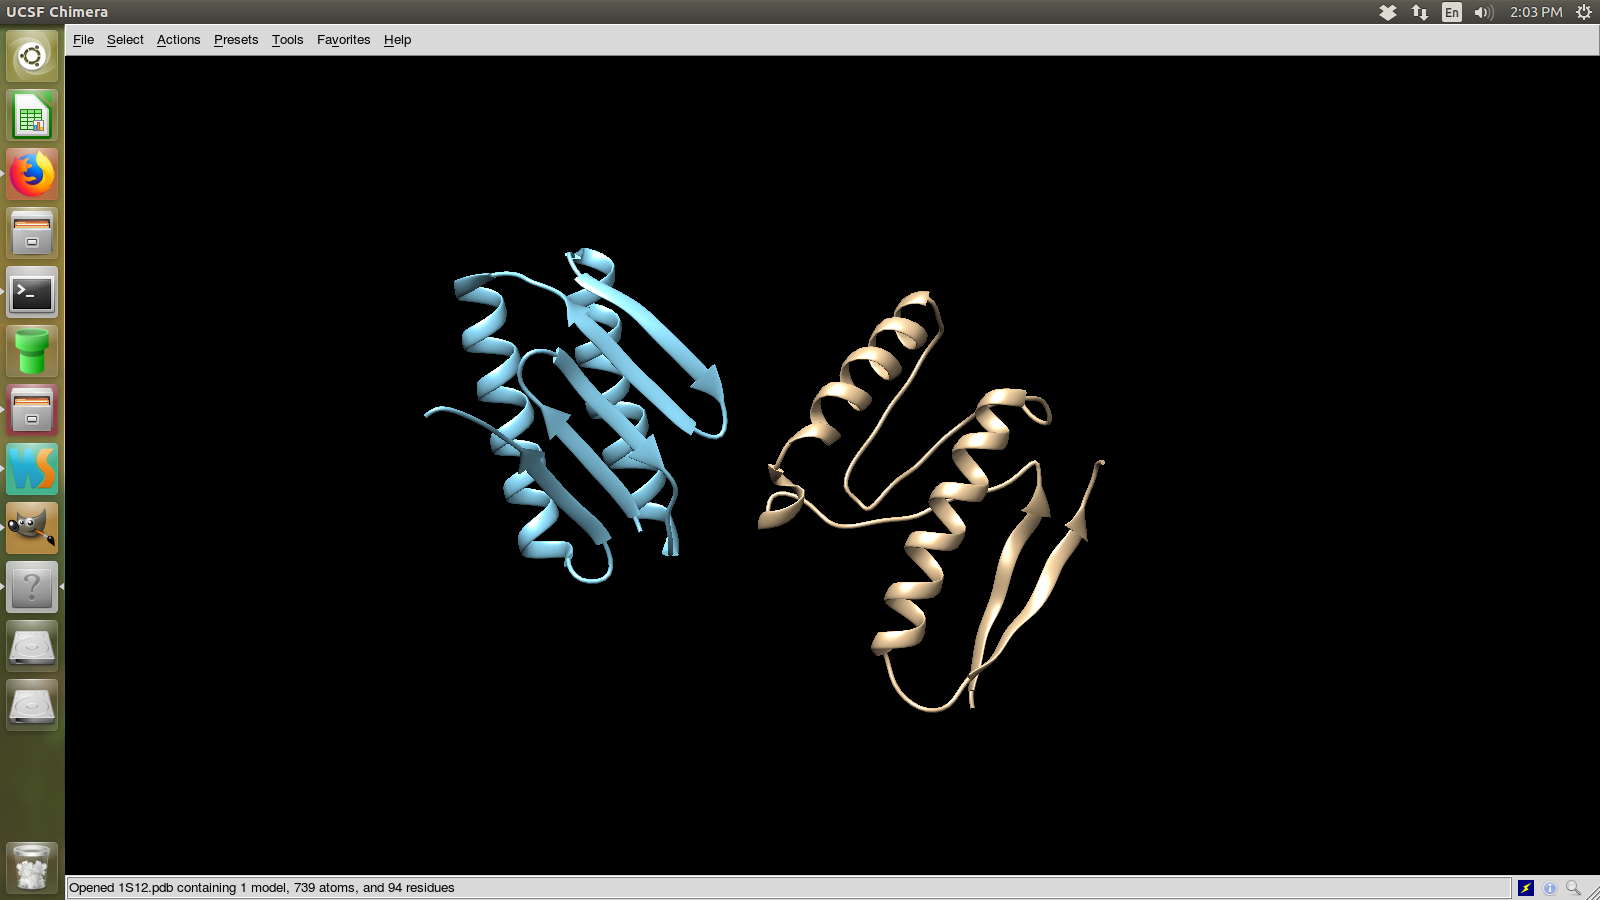
The model in yellow is the actual structure and in blue is the predicted.
Ethics/ safety considerations this week
Do your activities this week raise new ethics and/or safety considerations you had not considered in week 1? Describe what activities have raised these considerations and any changes you have implemented in response.
As this is a design assignment, it does not rise and ethical or safety concern.