Looking at protein structures using a viewer (PyMol or Chimera or Rasmol)
Pymol was selected as its easy to use.
Pick one of the five test cases in the homework folder and run structure prediction calculations.
The first one 1S12 protein structure was selected.
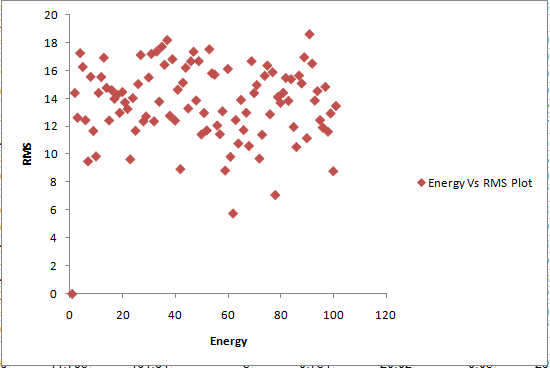
Plot the score (or energy) vs rms plot. Rms stands for root mean square deviation. These are two columns in the score.fsc file. Compare that with the energy vs rms plots I showed in my slides.
The energy vs rms plots are plotted in the chart below, taking data from the score.fsc file. It is noted that model no 64 has the lowest energy, -119.874 and model no 61 has the lowest rms, 5.764
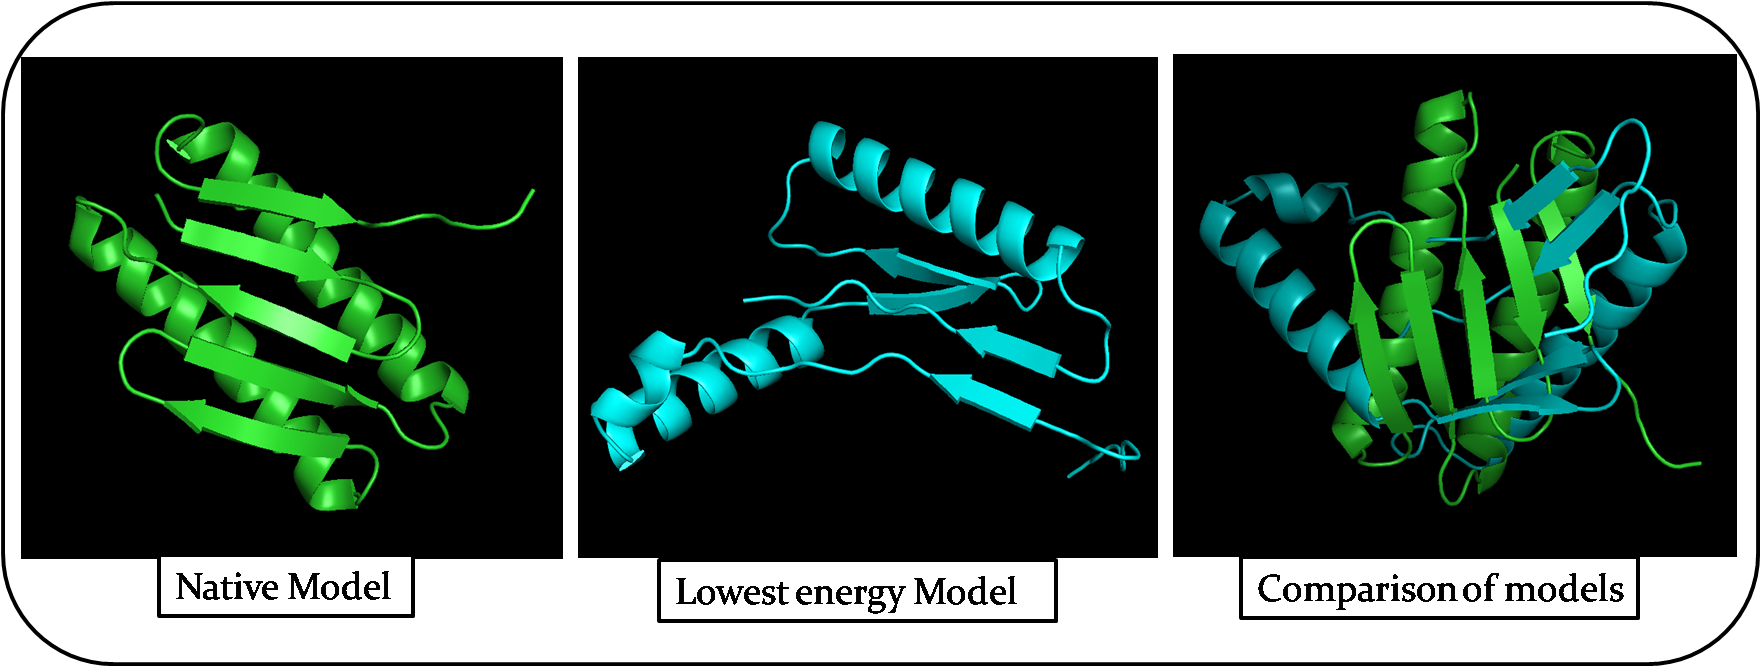
Pick the lowest energy model and structurally compare it to the native. How close is it to the native? If its different, what parts did the computer program get wrong? You'll have to compare the structures using a Viewer like Pymol or Chimera or Rasmol.
The lowest energy model is Number 64. The below table shows the structural differences between native model and lowest energy model. I compared both the models in PyMol using the command align Native, Model64.
| Attributes | Native model | Lowest Energy Model |
|---|---|---|
| Represented Colour of the model | Green | Blue |
| 3D structure after alignment | Not Similar | Not Similar |
| Number of Alpha helices | 2 - Parallel to each other | 2 - Perpendicular to each other |
| Number of Beta sheets | 5 | 4 |
| Length of Random coils | Short | Long |
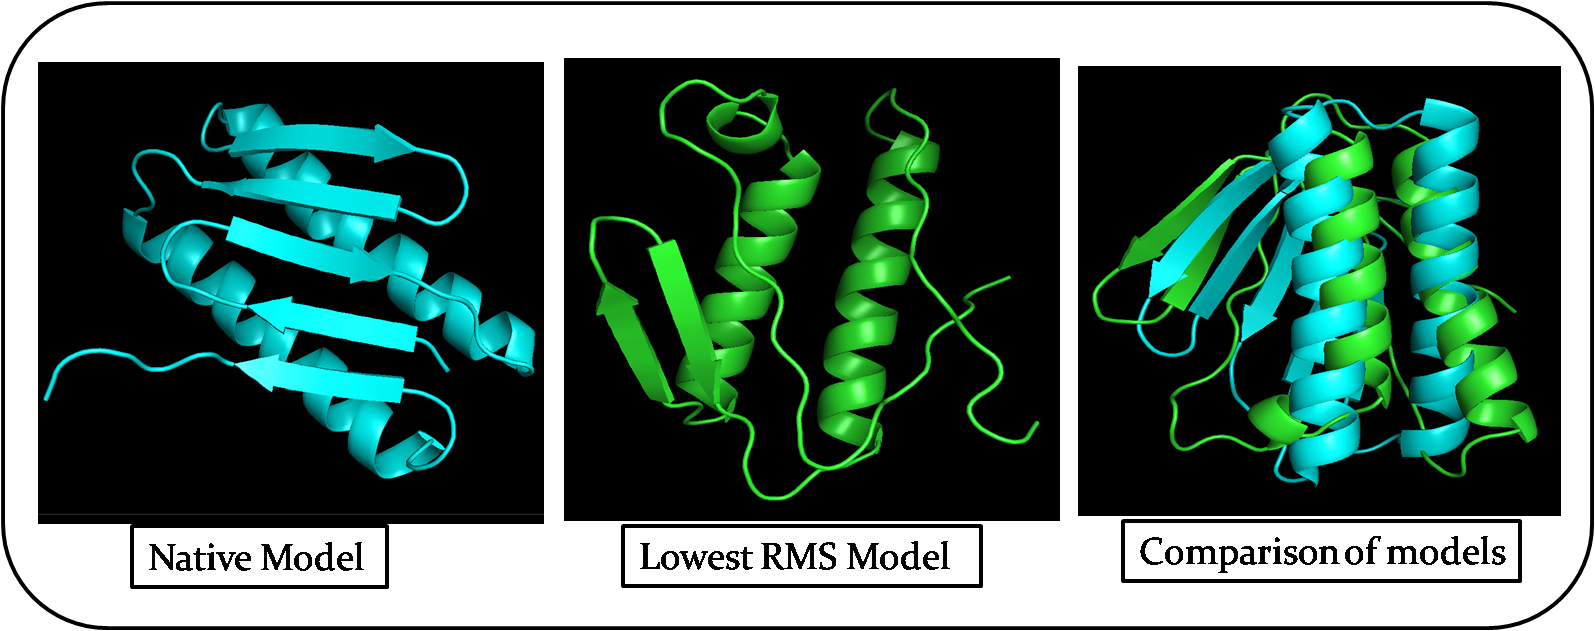
Pick the lowest rms model and structurally compare it to the native. How close is it to the native? If its different, how is it different? Remember that in a blind case, we will not have the benefit of an rms column.
The lowest RMS model is Number 61. The below table shows the structural differences between native model and lowest RMS model. I compared both the models in PyMol using the command align Native, Model61
| Attributes | Native model | Lowest RMS Model |
|---|---|---|
| Represented Colour of the model | Blue | Green |
| 3D structure after alignment | Somewhat Similar | Somewhat Similar |
| Number of Alpha helices | 2 - Parallel to each other | 2 - Parallel to each other |
| Number of Beta sheets | 5 | 3 |
| Length of Random coils | Short | Long |